
MI.BO. / INSIGHT SERIES 01ORIGINAL RESEARCH FEATURE / NOVEMBER 2026

300,000+ READINGS / YOUR WELLNESS GPS

The signal
we almost missed.

A smartphone. A simple face scan. A new window into everyday physiology.

MI.BO.SELFIE / LISBON 2025

What if you feel fine, but your body disagrees?

More than 300,000 voluntary physiological readings began a new conversation about what our bodies reveal.

ORIGINAL WEB SUMMIT FOOTAGE · LISBON 2025SCROLL TO EXPLORE
BEHIND THE RESEARCH / THE EVERYDAY EXPERIENCE

Meet MI.BO.Selfie.Your Wellness GPS.

MI.BO.Selfie turns a brief smartphone face scan into a personal wellness check-in, giving you a clearer view of your body's signals.

Using camera-based remote photoplethysmography (rPPG), the experience estimates pulse-related measures and presents insights such as heart rate, heart-rate variability and stress-related indicators in an easy-to-read snapshot.

FROM A SIMPLE SCAN TO A BIGGER QUESTION

As more than 300,000 voluntary readings accumulated, MI.BO. began exploring recurring patterns in physiological readiness. Those observations helped shape NeuraGrip, the framework examined in this research feature.

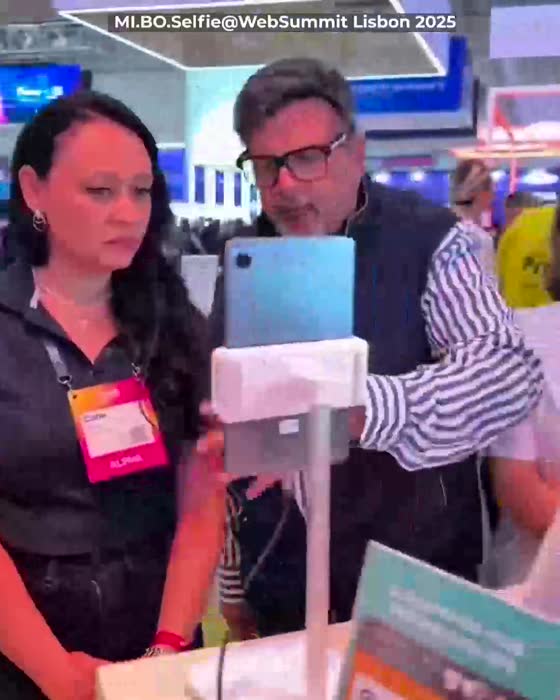
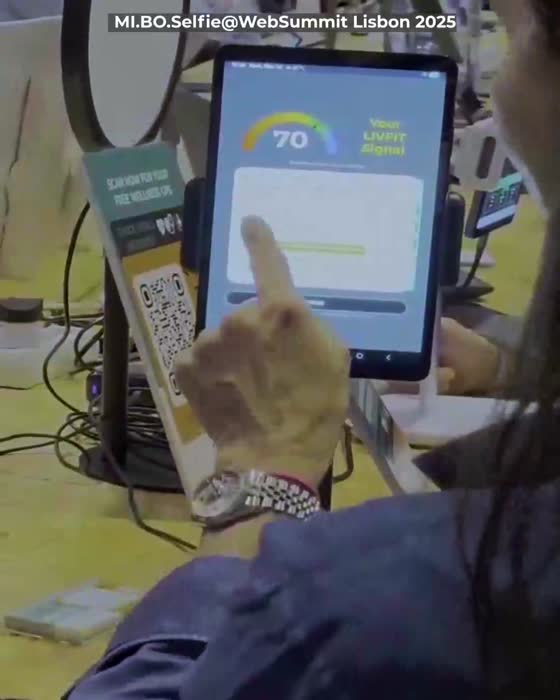
MI.BO.Selfie live demonstration with visitors at Web Summit Lisbon 2025 MI.BO.Selfie wellness scan interface displayed during a live demonstration
MI.BO.SELFIE
LIVE IN LISBON · 2025
Original MI.BO.Selfie Web Summit footage
01
SCANUse your smartphone camera for a quick face scan.
02
UNDERSTANDSee your pulse-related wellness indicators in one place.
03
NAVIGATETurn everyday readings into greater awareness over time.
PROGRAMME CO-FUNDING / PORTUGAL

Supported by European co-funding.

The MI.BO. digital health and wellness platform programme was co-funded through Portugal’s Recovery and Resilience Plan (PRR), with support from the European Union’s NextGenerationEU initiative.

PRR, República Portuguesa and EU NextGenerationEU co-funding logo strip Programme funding acknowledgement

Co-funding supported platform development. The research findings and interpretations in this publication are those of MI.BO.

AT A GLANCE

What 300,000+ readings revealed.

We have become fluent in describing how we feel. It is harder to know what our physiology is doing in that same moment. MI.BO.Selfie brings selected pulse-related signals into view through a smartphone camera.

Across more than 300,000 readings, we found an unusual concentration within our readiness-related index categories. A second comparison, between self-report and scan-derived thresholds, raised a question worth exploring.

01

Over 300,000 anonymized physiological readings were recorded from voluntary face scans between 2024 and 2026.

02

Within the NeuraGrip Index, 93% of readings were classified above the OPEN band.

03

The two reported threshold rates were 69.3% and 93%, a difference of 23.7 percentage points.

04

In a small pre/post observation involving 72 paired captures, immediate mean heart rate was approximately 5% lower following a 60-second reset.

300K+Physiological readings
93%Above OPEN classification
23.7ppAggregate threshold difference
72Paired Reset observations
01 / FROM FIELD FOOTAGE TO A QUESTION

The story
behind the signals.

At Web Summit Lisbon, visitors encountered a simple proposition: a familiar smartphone could reveal aspects of physiology they could not see. The demonstrations brought the idea to life. The larger questions emerged when we looked across years of readings.

01 / 03A public encounter with the technology
01 / THE HUMAN SIDE

A wellness tool moves into everyday life.

MI.BO.Selfie was designed around a simple ambition: bring useful physiological observation to the smartphone people already have, rather than requiring another device or a laboratory visit.

The Web Summit footage captures real conversations around a technology designed to make physiological observation more accessible.
02 / THE MEASUREMENT

Observation is not the same as understanding.

The platform captures a brief facial video signal and processes pulse-related optical variation. Over time, voluntary use generated more than 300,000 anonymized physiological reading records.

Each reading captures a moment. Looked at together, those moments allow us to ask whether certain patterns occur repeatedly across the platform.

03 / THE SCIENTIFIC QUESTION

What happens when perception and classification diverge?

The aggregate comparison revealed that two ways of describing readiness did not produce the same headline proportion. That contrast inspired a broader inquiry into the relationship between perception, physiology and everyday stress.

We called this line of inquiry NeuraGrip: a way to recognise and explore patterns of ongoing readiness, while continuing to test what the measurements can reliably tell us.

Web Summit Lisbon 2025 documentary footage; MEEVA signal visualisations.

02 / Behind a face scan

What can a smartphone camera measure?

Remote photoplethysmography (rPPG) uses tiny changes in reflected light to estimate pulse-related physiological signals from a short video capture.

01
Optical capture

A camera records transient light information from the face.

02
Signal processing

Algorithms seek pulse-related patterns amid lighting and motion noise.

03
Wellness interpretation

The resulting signals can be presented as measurements, trends and wellness categories that invite further observation.

MEEVA / CUSTOMER EXPERIENCE
MEEVA / SIGNAL ILLUSTRATION
INSIDE THE REPORTED CLASSIFICATION
93%

Above the
OPEN band.

In the MI.BO. NeuraGrip Index, 93% of included scans were placed above the lowest category, called OPEN. It is a distribution within the platform’s own classification system.

Explore all three classification views ↓
SOURCE / MI.BO. AGGREGATE OBSERVATIONS, 2024–2026 · INTERPRETIVE CATEGORY
02 / EXHIBIT 1 · CLASSIFICATION DISTRIBUTIONS

A closer look at the patterns.

Three views of one collection: NeuraGrip Index bands, derived state groups and the Four Locks.

93% of readings above the OPEN band.

Percentage of readings within the four NeuraGrip Index bands.

7
34%
41%
18%
OPEN7%
ARMED34%
LOCKED41%
LOADED18%

EXHIBIT 1 / MI.BO.Selfie reported category distributions, 2024–2026.

04 / Exhibit 2 · the perception question

A 23.7-point question.

Self-report and scan-derived classifications offered different views of physiological readiness.

Two aggregate threshold rates
69.3%
93%
Self-report thresholdNGI threshold
EXHIBIT 2 / Shares crossing the respective self-report and scan-derived thresholds.
23.7pp

Two different measures. Two different rates.

The nine-question Hostage Audit returned a 69.3% threshold rate, compared with 93% above OPEN in the NeuraGrip Index. Their difference tells us where to investigate further.

05 / Exhibit 3 · the people behind the readings

Who chose to scan?

The collection includes voluntarily reported information across age groups and health-related categories. These views show the composition of available records.

Original documentary frame showing an MI.BO.Selfie conversation at Web Summit Lisbon
Original documentary frame of the MI.BO.Selfie platform interface in use
Real footage / Lisbon 2025

A snapshot of participation.

Explore the reported age, gender, body-mass-index and blood-pressure categories. Each chart uses the records for which the relevant field was supplied.

Age distribution in records with reported age
18–248%
25–3422%
35–4427%
45–5423%
55–6414%
65+6%

Distribution among readings with the selected field supplied.

EXHIBIT 3 / Voluntarily provided characteristics. These descriptive categories do not represent population prevalence.

GLOBAL FOOTPRINT / PROCESSING REGIONS

A signal with global reach.

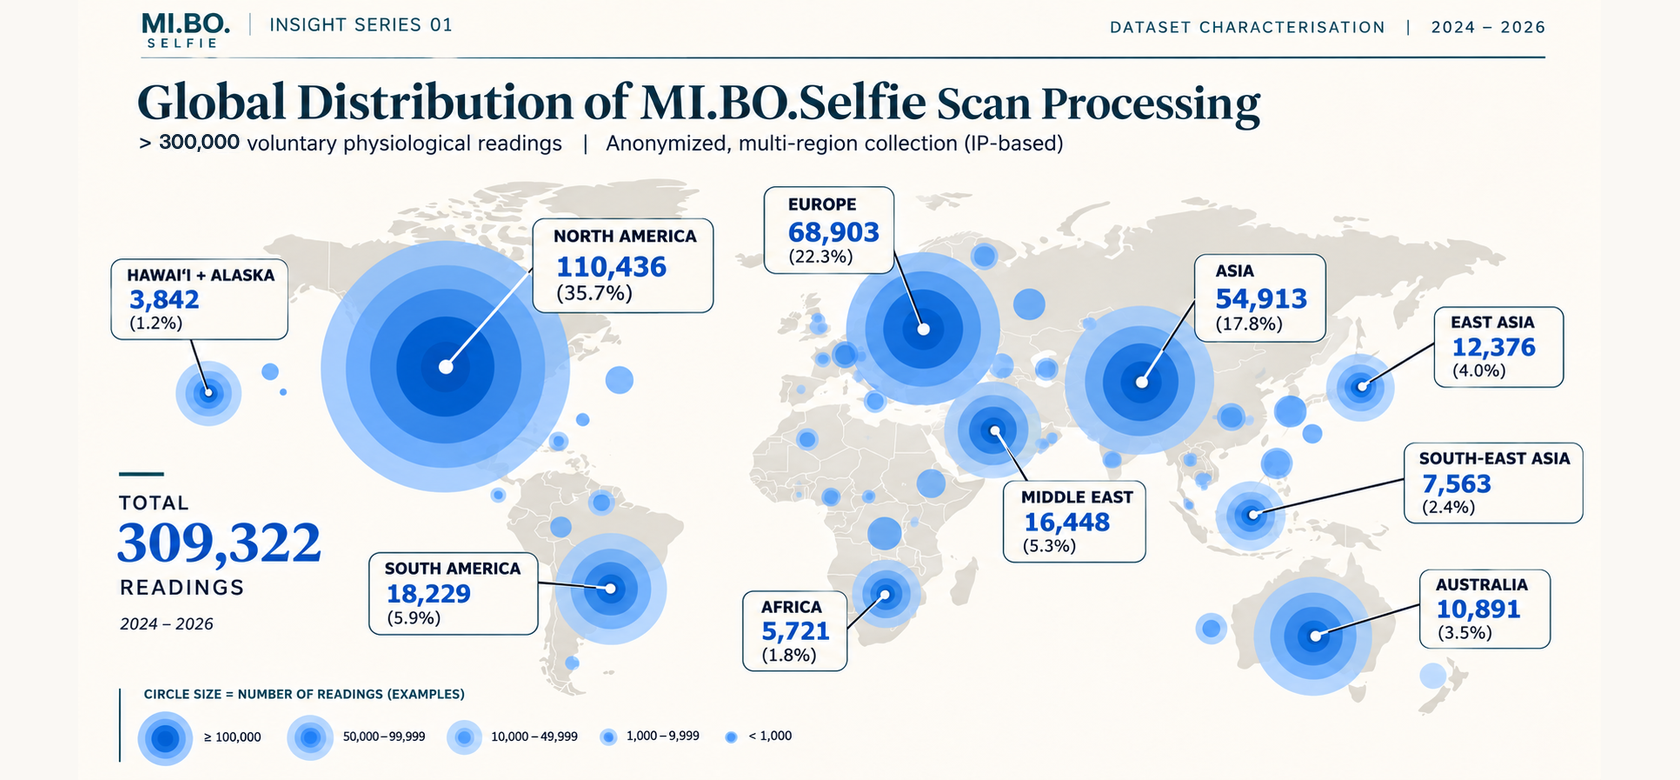
MI.BO.Selfie scan processing spanned multiple regions, including North America, Europe, the Gulf and South Asia, during the 2024–2026 observation programme.

World map highlighting representative scan-processing regions: North America, Europe, the Gulf and South Asia. No scan counts are assigned to markers.
Selected processing regions represented in the MI.BO.Selfie platform's reported infrastructure footprint, 2024–2026.
View full-size world map ↗
01North America
02Europe
03The Gulf
04South Asia

The map represents broad processing regions, not verified participant locations. The original dataset summary did not provide auditable geographic scan counts.

06 / Exhibit 4 · a 60-second question

Can 60 seconds make a measurable difference?

In an early MI.BO. wellness observation, 72 participants completed a reading, performed the 60-second NeuraStance sequence, and completed a second reading immediately afterward.

A first look at how the scan captured an immediate physiological shift.

See what this finding does — and does not — prove ↓
Illustrative normalization / not bpm
100
95
Before
Immediately after
72Paired capture sequences
in the source report
≈5%Lower immediate mean HR
as reported

EXHIBIT 4 / 72 paired readings, without a separate control group. Further controlled research would be needed to establish causality and lasting effects.

07 / From observation to inquiry

Giving the pattern a name.

NeuraGrip gives language to the patterns of readiness that the observations invite us to explore.

NeuraGrip is a framework for observing patterns of readiness in everyday life.

Four Locks, four perspectives. Vigilance, structural posture, breath and fuel are lenses for interpreting the experience of ongoing readiness.

Explore the Four Locks to recognise where readiness may show up in your day.

The Four Locks Dominant classification
Vigilance31%
Structural27%
Breath23%
Fuel19%

Each scan belongs to one reported dominant category.

Four Lock shares refer to the reported dominant classification in each reading; “structural” corresponds to “posture” in the earlier aggregate charts.

07 / DATA STEWARDSHIP

A reading, not a portrait.

The observation dataset described here was built around physiological measurements rather than stored facial photographs. This is how the reported processing pathway works.

01 / CAPTURE

Transient camera signal

Face-camera light information is captured for signal processing.

02 / DERIVE

Physiological estimates

Algorithms derive pulse-related outputs from optical fluctuations.

03 / RECORD

Anonymous output

The analysis records are reported not to retain face photos, video, templates, names or email alongside outputs.

04 / ANALYSE

Aggregate views

Proprietary classifications and selected voluntary characteristics are summarised.

Data-handling description reflects MI.BO. reporting of the observation dataset. Individual consent and privacy rights remain governed by the platform’s applicable notices and policies.

08 / WHAT THE EVIDENCE SUPPORTS

What the findings can tell us.

This is what the first observations show, and where the next evidence will deepen the picture.

TopicWhat we observedWhat we are investigating
The technologyPublished studies show that a camera can estimate pulse-related signals under appropriate conditions.How MI.BO.Selfie performs across devices and real-world conditions.
The datasetMore than 300,000 voluntary readings provide descriptive distributions across MI.BO. wellness categories.How patterns vary by participant, setting, repeated use and time.
Perception and signalsThe reported threshold percentages differ by 23.7 points across two measures.How the two measures agree or differ when compared within the same individuals.
The 60-second ResetA small paired observation showed an immediate mean heart-rate reduction of about 5%.How that shift compares with control conditions and whether it lasts.
The NeuraGrip frameworkA practical vocabulary links perceived readiness with structural, breathing and other wellness contexts.Whether these categories predict meaningful trends beyond established measures.
09 / WHAT COMES NEXT

Where we go from here.

The next chapter is about connecting these early patterns to more precise measurement, deeper understanding and practical benefits that can be demonstrated over time.

01

Better baselines

Distinguish day-to-day variation from a person’s longer-term physiological patterns.

02

Clearer comparisons

Bring self-reported experience and scan-based classifications into the same longitudinal view.

03

Greater confidence

Test physiological measurements with trusted reference instruments under everyday conditions.

04

More inclusive evidence

Study how results vary with age, devices, lighting, movement and other circumstances.

05

Small actions, measured

Explore whether simple self-regulation practices produce meaningful and repeatable changes.

MI.BO. / Wellness GPS

We began with a face scan. We discovered a bigger question.

What if self-understanding could begin with a measurement anyone can take, interpreted with care and revisited over time? That is the opportunity MI.BO.Selfie continues to explore.

Download the research reportReview the methods and sources ↓
Notes / Source register

Methods and references.

A concise account of the methods, definitions and research literature behind this feature.

About the dataset

The analysis draws on MI.BO. Lda’s aggregated MIBOSelfie readings collected through voluntary scans in 2024–2026. More than 300,000 refers to measurement records, not necessarily distinct people. The accompanying PDF presents the main analysis, category distributions and methodology. Read the research report.

How to interpret the sample

Participation was voluntary and self-selected. Individuals could contribute multiple readings, and not every record contains every demographic field. These descriptive percentages should not be used to estimate population prevalence.

About the perception comparison

The 69.3% self-report rate comes from the nine-question Hostage Audit; the 93% scan-derived rate uses the NeuraGrip Index threshold above OPEN. Their difference is 23.7 percentage points. This aggregate contrast does not establish the rate of disagreement within individual matched participants.

Participant characteristics

MI.BO. reported age categories of 18–24 (8%), 25–34 (22%), 35–44 (27%), 45–54 (23%), 55–64 (14%) and 65+ (6%). Gender: female 58%, male 41%, other or undisclosed approximately 1%. BMI: underweight 3%, normal 32%, overweight 38%, obese 27%. Reported blood-pressure categories: normal 41%, elevated 24%, stage 1 22%, stage 2 13%. Field-level counts were not available for independent analysis.

The 60-second observation

The Reset exhibit is based on 72 paired pre/post captures and an approximately 5% lower immediate mean heart rate after the sequence. The visual index (100 versus 95) is normalized for illustration, not an actual heart-rate measurement. The observation had no reported control group or longer-term follow-up.

Scientific background

The studies below examine remote photoplethysmography and slow breathing. They provide context for the field, not independent validation of MI.BO.Selfie or the NeuraGrip Index.

About the videos

Web Summit Lisbon 2025 footage shows MI.BO.Selfie demonstrations and conversations. MEEVA animations illustrate the general signal-processing concept. The video material is documentary and educational rather than evidence of clinical outcomes.

European co-funding

The MI.BO. digital health and wellness platform development programme was co-funded through Portugal’s Recovery and Resilience Plan (PRR), supported by the European Union’s NextGenerationEU initiative. Funding relates to platform development. Findings and interpretations are attributable to MI.BO. Portugal PRR communication resources.

Geographic processing footprint

The geographic exhibit shows representative regions identified in the earlier MI.BO.Selfie global processing summary, including North America, Europe, the Gulf and South Asia. The location of a processing centre is not necessarily the location of a person taking a scan. The source materials did not contain sufficiently detailed regional counts to reproduce the original bubble-size weighting.